27 September 2005

Left-Handedness And Breast Cancer

Are left-handed women at higher risk for breast cancer? Some Dutch researchers found the answer may be "yes".

Early Pre-Natal Development

Photo of 11-week fetus, from http://www.pregnancy.org/pregnancy/fetaldevelopment1.phpWhen you are developing in the womb, especially in the first trimester when key developmental events occur, the levels of sex hormones in the umbilical bloodstream from your mother may affect many traits you will show as an adult.

It has been known for some time that prenatal exposure to sex hormones can affect a woman's risk of breast cancer later in life. (For example this study, Maternal factors and breast cancer risk among young women, indicated a mother's use of diethylstilbestrol (DES, a synthetic estrogen) was associated with a 2.3 times higher risk of breast cancer for her daughter.)

There is also some evidence that prenatal hormone exposure affects brain lateralization and/or hand preference. For example see the paper Handedness and other laterality indices in women prenatally exposed to DES.

Recent Research Results

The recent findings of the Dutch researchers are reported in the online version of the British Medical Journal: "Innate left handedness and risk of breast cancer: case-cohort study" (PDF file here).

The researchers "found that left-handed women are more than twice as likely to develop premenopausal breast cancer as non-left handed women. This risk is compatible with left handedness being a marker of constitutional risk rather than of environmental risk as with postmenopausal breast cancer." They pointed out that both breast cancer risk and left handedness have been associated with prenatal exposure to sex hormones, but their research did not show the cause of the correlation, only that it exists.

Cuno Uiterwaal, an assistant professor of clinical epidemiology at the University Medical Center in Utrecht, and one of the authors of the recent publication, said, "What our study intends to do is focus on this area. We do not know all the causes of breast cancer, that is why we should continue. This may be one new factor that leads us to a better understanding of the etiology."

Finger-Length Ratios

There are other adult traits associated with intrauterine exposure to sex hormones. Finger-length ratio (the ratio of the length of the second to the fourth digits, the index finger to the "ring" finger) is sexually dimorphic (different, at least statistically, between boys and girls), and is thought to be associated with pre-natal exposure to androgen hormones. For example, in opposite-sex twins, the transfer of androgenic hormones from the boy baby to the girl baby may cause her to have finger-length ratio more typical of a male.

Illustration of typical finger length ratios of men and women, from http://news.bbc.co.uk/1/hi/sci/tech/695142.stm
Research has tried to see if this possible evidence of steroid hormone exposure in the womb is linked with other adult traits, such as sexual preference, tendency to violence, and so on.

Hand Preference

The research relating to how prenatal exposure to hormones affects hand preference is still very sketchy. There is apparently a strong genetic component to hand preference, as discussed in this previous Science In Action post. (Dr. Klar has found additional support for his thesis that hand preference is genetic, and linked to hair-whorl direction.)

Additional Resources

Paper entitled Association of fetal hormone levels with stem cell potential: evidence for early life roots of human cancer

Nice site on brain lateralization and handedness

The challenges for left-handers, and those who have to deal with them. E.g. those damn school desks!

And check out Great Left Handed People in this sister blog. 

Technorati tags: , , , , ,

Project Steve

Two facts are clear:
  1. Although there are some scientists who have doubts about the theory of evolution by natural selection, and some who are even strict biblical creationists, the vast majority of scientists, especially biologists, firmly believe evolution is a fact and the theory of natural selection is one of the most powerful tools of modern science, and

  2. Some scientists have a sense of humor.
In response to the ongoing effort of evolution deniers and creationists to portray the theory of evolution by natural selection, and even evolution itself, as "in crisis" with many scientists doubting their validity, a few years ago a gentle satirical parody was devised.

Photo of Stephen Jay Gould from http://en.wikipedia.org/wiki/Stephen_Jay_GouldWhile holding that the usefulness or validity of scientific theories cannot be decided by dueling lists of adherents, the parodists sought to demonstrate that evolution deniers were but a tiny minority of practicing scientists. They launched "Project Steve". To be listed, a scientist had to subscribe to the statement below, and be named Steve (or Stephen, Steven, Stephanie, Esteban, or a similar cognate name.) (The name Steve was chosen to honor the great evolutionary biologist, paleontologist and essayist Stephen Jay Gould.)

The Statement

"Evolution is a vital, well-supported, unifying principle of the biological sciences, and the scientific evidence is overwhelmingly in favor of the idea that all living things share a common ancestry. Although there are legitimate debates about the patterns and processes of evolution, there is no serious scientific doubt that evolution occurred or that natural selection is a major mechanism in its occurrence. It is scientifically inappropriate and pedagogically irresponsible for creationist pseudoscience, including but not limited to "intelligent design," to be introduced into the science curricula of our nation's public schools."
Check out the "Steve-o-Meter" to see how many Steves have subscribed so far. As of this writing there are about 630 Steves on the list.

To be fair, here are links to some of the lists of scientists and others who doubt, or doubted, evolution:


Additional Resources

The Project Steve page at the National Center for Science Education

Geotimes article on Project Steve
Technorati tags: , , , , ,

21 September 2005

NASA's New Moon Program

New MoonNew Moon picture
NASA has formally announced Operation Moon 2 (as I call it). Its 15-year mission: To boldly go . . . where we already went 40 years ago.

This plan will achieve President Bush's goal of returning a man to the Moon and landing him safely on the Earth. More than that, NASA boss Mike Griffen promised, "We will return to the moon no later than 2020 and expend [sic] human presence across the solar system and beyond." (pdf of press conference transcript)

And beyond?? Does he mean Alpha Centauri?

There are articles at Space.com, NASA.gov flash animation, NASA's announcement, and MSN.com.

Using concepts and equipment from Apollo, Soyuz, and the Shuttle, ("Think of it as Apollo on steroids," said Administrator Griffin), and operating within a projected budget of about $100 billion (figure about $200 billion after overruns on past form--that's only about 1.5 years of Operation Enduring Freedom spending), humans could be walking on the moon as early as 2018.

Some have asked why are we returning to the Moon (other than because President Bush said we would during the last presidential campaign). Here is what the NASA site says about the objectives of the project:
  • "Before the end of the next decade, NASA astronauts will again explore the surface of the moon."

  • "And this time, we're going to stay, building outposts and paving the way for eventual journeys to Mars and beyond." (This suggests another headline: "NASA to Pave Moon".)

  • "After landing and exploring the surface for seven days, the crew blasts off in a portion of the lander, docks with the capsule and travels back to Earth."
The main purpose of the project seems to be travel, rather than any specific scientific goal. This is not a science project, but a political boondoggle: a "Moondoggle"!

The Project Apollo moon landings in the 60s and 70s had little scientific justification, either. They were a way for America to demonstrate its economic and technological power, as part of the Cold War.

The new Moon plan is again a demonstration of power. Americans can only hope that its cost will not weaken the nation more than its achievements strengthen it.

Technorati tags: , , , , ,

17 September 2005

Storm Warning -- Hurricane Katrina and Global Warming

image of hurricane warning flagsIs Hurricane Katrina an example of "Global Warming" affecting the local weather? Recent evidence suggests that the warming of the oceans caused by our generation of greenhouse gases over the past century or two may be causing more intense hurricanes.

Climate scientists have known for some time that
  1. The Earth is heating up, and
  2. As the Earth's surface and atmospheric temperatures increase, this will affect the distribution and intensity of weather events.

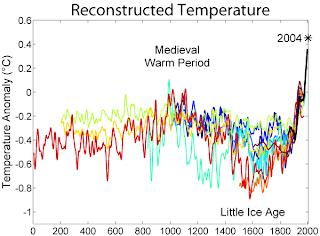
Global Warming Is Real

Among scientists, any remaining arguments about global warming are questions of degree. There are a few lonely holdouts, as there are with any paradigm shift in science (Leading 19th century American scientist Louis Agassiz went to his grave opposing Darwin's theory of evolution by natural selection). But most of the denial is outside the scientific community and is purely political. (That is to be expected -- see my earlier post on science and politics.)

Graph of Global Temperature Over Past 2000 Years

Sea Temperatures Affect Storms

One predicted effect of global warming is an increase in the intensity of hurricanes and tropical storms. As sea surface temperatures increase, these storms can draw more energy and moisture from those warmer waters.

What Drives a Hurricane?

The intense tropical cyclonic storms we call hurricanes (or typhoons, baguio, or cyclones) are driven by transfer of heat from the ocean to the atmosphere. They can form only over warm water (at least 26°C). The air over the sea is warmed, decreases in density, and therefore rises. The coriolis effect is strong enough to cause these rising currents to form spiraling winds. As the warm air expands and rises it cools, and eventually the water vapor in it condenses, releasing heat.

Heat of Condensation

As everyone knows, to boil water into steam (convert it into water vapor) you have to apply heat. When that water vapor recondenses that heat is released. Since water is a polar molecule, it takes a lot of heat to vaporize (evaporate) it, and a correspondingly large amount of heat is released by condensation.
This heat warms the air, causes further expansion, and reduces the atmospheric pressure below even further. As long as the system remains over warm water this cycle can build and the storm grows in size and windspeed.

Recent Research Has Shown:

1. Sea surface temperatures are clearly rising. This is one of the clear signs of global warming.

An influential study demonstrating that human activities have caused these sea surface temperature increases was reported in this press release from the Scripps Institution of Oceanography. Here is a pdf file of the article "Penetration of Human-Induced Warming into the World's Oceans" in Science. (If that link to the pdf doesn't work, get it through Dr. Pierce's publications site.)

Abstract

A warming signal has penetrated into the world's oceans over the past 40 years. The signal is complex, with a vertical structure that varies widely by ocean; it cannot be explained by natural internal climate variability or solar and volcanic forcing, but is well simulated by two anthropogenically forced climate models. We conclude that it is of human origin, a conclusion robust to observational sampling and model differences. Changes in advection combine with surface forcing to give the overall warming pattern. The implications of this study suggest that society needs to seriously consider model predictions of future climate change.
2. Increasing sea surface temperatures will cause stronger hurricanes.

A recent paper, "Increasing destructiveness of tropical cyclones over the past 30 years", published in Nature, confirms what theory predicts: hurricanes have increased in intensity as seas have warmed, and the two factors are highly correlated. Here is a pdf file of the article.

Abstract

Theory and modelling predict that hurricane intensity should increase with increasing global mean temperatures, but work on the detection of trends in hurricane activity has focused mostly on their frequency and shows no trend. Here I define an index of the potential destructiveness of hurricanes based on the total dissipation of power, integrated over the lifetime of the cyclone, and show that this index has increased markedly since the mid-1970s. This trend is due to both longer storm lifetimes and greater storm intensities. I find that the record of net hurricane power dissipation is highly correlated with tropical sea surface temperature, reflecting well-documented climate signals, including multi-decadal oscillations in the North Atlantic and North Pacific, and global warming. My results suggest that future warming may lead to an upward trend in tropical cyclone destructive potential, and--taking into account an increasing coastal population--a substantial increase in hurricane-related losses in the twenty-first century.
Whether we are seeing an increase in the number of hurricanes and typhoons is less clear. The theoretical basis for such an increase based on higher sea surface temperatures is also not established. [Update: Evidence inSee this more recent post.]

Breaking News

Graph from Science editorial showing upward trend in category 4 and 5 stormsAnother study has recently been published: "Changes in Tropical Cyclone Number, Duration, and Intensity in a Warming Environment". (Editorial about the findings, which is the source of this graph; link to full text in Science)

Abstract and concluding paragraph

We examined the number of tropical cyclones and cyclone days as well as tropical cyclone intensity over the past 35 years, in an environment of increasing sea surface temperature. A large increase was seen in the number and proportion of hurricanes reaching categories 4 and 5. The largest increase occurred in the North Pacific, Indian, and Southwest Pacific Oceans, and the smallest percentage increase occurred in the North Atlantic Ocean. These increases have taken place while the number of cyclones and cyclone days has decreased in all basins except the North Atlantic during the past decade.

We conclude that global data indicate a 30-year trend toward more frequent and intense hurricanes, corroborated by the results of the recent regional assessment. This trend is not inconsistent with recent climate model simulations that a doubling of CO2 may increase the frequency of the most intense cyclones, although attribution of the 30-year trends to global warming would require a longer global data record and, especially, a deeper understanding of the role of hurricanes in the general circulation of the atmosphere and ocean, even in the present climate state.
The research reported in these articles is not the last word, and some other scientists don't completely agree with these findings. But it sure is beginning to look like the evidence supports the existence of these trends and implications.

Hurricane Warning

These changes have been caused by an increase in the temperature of the top 300 meters of the world's oceans of about one-half degree Celsius over the past fifty years. Global temperatures are expected to rise between 2°C and 4°C over the coming century. Think how this will affect hurricane strength and other weather! And consider the enormous amount of heat that had to be added to the oceans to raise their surface temperatures even 0.5°C. It would take centuries for them to cool down (or even to stop warming up!) even if we immediately stopped the human activities that contribute to global warming. Maybe we and our descendants had better get used to a stormier future.


Update

[2013-03-19 1530GMT: Recent research found a "twofold to sevenfold increase in the frequency of Katrina magnitude events for a 1 °C rise in global temperature". That is pretty scary. Reuters item here. Abstract of PNAS article here.]

Additional Resources

The world scientific consensus on global warming is summarized by the Intergovernmental Panel on Climate Change of the UNEP and WMO. Here is its summary of evidence for sea surface warming trends. Here are graphs of sea surface temperatures from that report.

Wikipedia article on global warming.
The Tropical Storm Risk consortium predicts a record-severe hurricane season this year. Here is a press release regarding their updated forecast of 5 August (here is the pdf file with details).


Technorati tags: , , , , , , ,

13 September 2005

Bush Poll Numbers -- Margin Of Error

"Bush Approval Rating Hazy . . . Try Again." No headline ever says that. They always give a specific approval rating, say "40%", based on some recent poll. They ignore the fact that such a result is not so precise, but is rather hazy. The "margin of error" figure buried somewhere in the article is the key to understanding just how hazy that "40%" number really is.

Why Are These Poll Results So Variable?

A number of polling organizations regularly ask Americans about how the President's performance is perceived (see table below for recent results). The question is along the lines of "Do you approve or disapprove of the way George W. Bush is handling his job as president?" Note that although these polls all asked almost exactly the same question over the same few days between 6 and 9 September 2005, yet they give a range of results.

Bush Approval Rating, Various Polls

PollDate, Sept. '05Approve, %Disapprove, %Margin of Error,
percentage points
AP/Ipsos6-839593.1
Time7-842523
Newsweek8-938553
CBS6-742524
Pew6-740523.5
Zogby6-740592.9
Source: Pollingreport.com


The results of such polls always refer to something called "margin of error". What does that mean, and is it important for interpreting poll results?

What is the "Margin of Error"?

Understanding the concept referred to by pollsters as "margin of error" is vital to understanding poll results. Unfortunately, many journalists don't understand this concept or its importance, and thus news stories often mislead based on misinterpretation of polls. (See earlier post on this subject.)

"Margin of error" is the term the media use for what statisticians call the "confidence interval". It would be more properly called "margin of accuracy", or even "margin of inaccuracy".

Polls purport to tell us the opinions of some group of people. In the case of the political polls discussed here that group is all the adults in the U.S.A. (Sometimes polls focus on other groups, such as registered voters, likely voters, men, women, Republicans, Democrats or independents, or people in a particular state.)

There are about 220,000,000 people in the U.S.A. over 18 years old. It would be impossible to ask each and every one of them his or her opinion of the President's performance. Therefore we only ask a sample. Polling is sampling. How well the results from this sample represent the results you would get if you actually could poll the entire adult population is described by the "margin of error", "sampling error", or "confidence interval" statistic.

The key is to use a random sample. As discussed in another previous post, we can't really get a totally random sample, but pollsters, epidemiologists, and other researchers have established methods for at least getting a quasi-random sample of a population.

If the sample is random (anyone in the population has an equal chance of being included in the sample), the math of statistical sampling tells us that if you sample only one thousand people from that universe of 220 million, you will get a fairly good representation of the true opinion of the whole population.

In fact, you can be sure that the result from the sample (for example, 40% say they approve the job the President is doing), plus or minus the confidence interval (say 3 percentage points), will include the actual result you would have gotten from the whole universe from which the sample was drawn 95% of the time. There is only a 5% chance (one time in 20) that the true result is outside that "95% confidence interval". So in this case the pollster would be saying that it is pretty likely that between 37% and 43% of U.S. adults approve the President's job performance.

Note: The math of statistical sampling means that the pollsters don't actually know the exact approval rating the whole population would give. They only know that there is a 19-in-20 chance that the approval rating for the whole adult population is between 37% and 43%, based on the results from the one thousand people they actually asked. They don't really know where within that range the rating from the whole population would be, only that there is a 95% chance that it is in that range.

If exactly the same poll were to be performed twice, with the same sample size drawn from the same population at the same time, the results of those two samples would almost certainly be different. In fact there is a 1-in-20 chance that their confidence intervals wouldn't even overlap.

So polls are like the old Magic 8 Ball®: They always answer "Reply hazy, try again". The "margin of error" is supposed to show just how hazy that result is.

Here is that table of poll results again, restated to take into account their confidence intervals.

Bush Approval Rating, Various Polls,
showing confidence ranges

PollApprove, %Disapprove, %
AP/Ipsos35.9-42.155.9-62.1
Time39-4549-55
Newsweek35-4152-58
CBS38-4648-56
Pew36.5-43.548.5-55.5
Zogby37.1-42.956.1-61.9
Source: Pollingreport.com


Notice that now instead of all of the results being different, they are all the same. All of the "approve" ranges overlap. There is no significant difference between their results. (the "disapprove" ranges don't overlap. The AP/Ipsos and Zogby polls report significantly higher disapproval numbers than the others, which all overlap. This may be explained by the details of the way the question was phrased, how the "not sure" responses were handled, and the particular sampling methods used.)

A graphical display would show this better. I'll try to add one later.


For Further Information

Robert Niles has a good site on statistics for journalists.

Good Wikipedia article (includes a bit of math)

There is a nice Flash animation of a Magic 8 Ball® at this Mattel site (click on select game then on the game demo button)

Technorati tags: , , , , , , ,